Crop Talk
Weather in western Oregon has been unusually wet and cool. In March there were only 5 days without rain. April has been about as bad. Fields are very wet and farmers are struggling to get fertilizing and spraying done in a timely manner, especially on the annual crops.
Characteristics
The 2002 NTEP Report on Tall Fescues has just been released. In case you haven’t had a chance to take a look at all 160 entries - yes 160 entries! – we’ve captured some of the highlights on our top 2 varieties. If you don’t get the NTEP sent to you directly, you can access it at www.ntep.org.
Rendition
- Great quality ratings in CA, IL, IN, MD, MO, NJ, NY, PA, VA, WI
- Top rated in the Northeast, Mid-Atlantic, Pacific Excellent performance under 1.5-2” cut
- Fine-leaved Texture
- Impressive Drought Tolerance
- Great Brown Patch Resistance
- Good Seedling Vigor Solid Spring, Summer and Fall Ground Coverage
- Quick Establishment
- Shorter Canopy Height
- Excellent Resistance to Pink Patch

Titan Ltd.
- Great quality ratings in IA, KS, NJ (Traffic Study), NY, WA, TX
- Excellent performance under traffic stress
- Top rated in the Northeast, Mid-Atlantic, Pacific
- Good Seedling Vigor
- Great density – spring, summer, and fall
- Solid Spring, Summer and Fall Ground Coverage
- Quick Establishment
- Shorter Canopy Height
- Excellent Resistance to Pink Patch
- Great Brown Patch Resistance
Did you know?
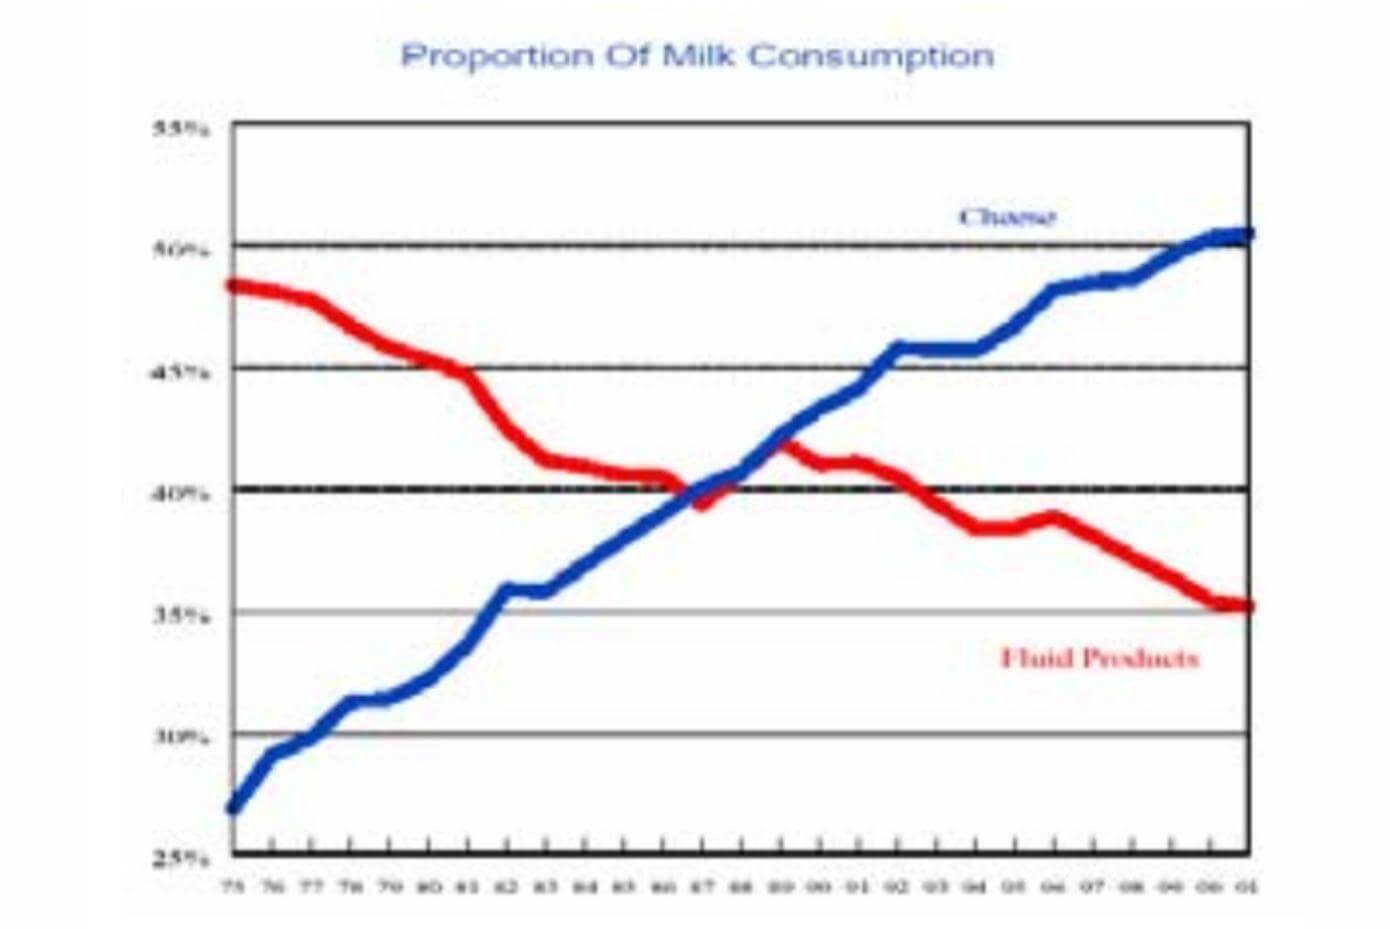
Per capita consumption of Italian cheese increased 270% from 3.24 pounds in 1975 to 12.00 pounds in 2001! Overall, Americans eat nearly 30 lbs of cheese a year. Since 1988, milk used in the consumption of cheese (1 lb. cheese = 10 lbs. milk) has exceeded the fluid & cream consumption. The difference has increased in each subsequent year. In 2000, milk consumed in cheese increased to 50% of the total milk consumption! In spite of flavored milks, flashy new packaging, creative marketing campaigns, etc., consumption of beverage milk continues to decline – from an annual per capita consumption of 31 gallons to an estimated 23 gallons for 2003.
Now, mom doesn’t say “drink your milk” – rather “eat your cheese!”– from USDA and Farming Magazine May 2000
